软件介绍(Software introduction)
Golden Software Voxler是一种以图形方式表示3D数据的创新方法。它允许您从各种来源导入数据并创建反映数据之间复杂关系的高质量图形。Golden Software Voxler是用于处理任何复杂性的模型和数据的多功能交互式图形环境。友好的用户界面可快速可视化,评估,研究和验证您的数据。
官方网址:https://www.goldensoftware.com/products/voxler
试用链接:https://www.goldensoftware.com/products/voxler/trial
官方试用没有说明时间,我没有尝试,无限访问Voxler的所有功能,但打印,保存,复制,剪切和导出除外。
软件价格:这里一定要说下哈,有学生邮箱的可以搞下$50每年,其实价格也不便宜。
Golden Software Voxler可以用于各个领域:
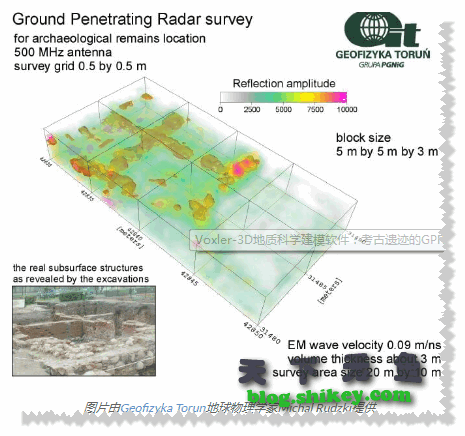
在地质学中(使用井的三维数据时)和岩石学,用于地震研究。
在气象学中,通过收集和处理三维数据来研究大气。
在海洋学中,研究水温,盐度和污染。
在生物学和医学上(用于进行超声研究)。
在工程,统计,地震学等领域
主要规格:
创建等值面的功能使您可以扩展轮廓图的功能,并在三个维度上描绘常数值的表面。您可以在同一张图上绘制几个等值面,为每个图选择自己的颜色和透明度。
在体积图上,为三维网格的每个元素分配了颜色和透明度。ClipPlane功能可让您以任何角度进行切割。
等高线图显示恒定平面值的线。您可以以任意角度放置平面和轮廓。
在高度场图中,数据在位于三维空间中的矩形平面或二维曲线网格上以不同的颜色表示。数据的幅度以垂直于此平面或弯曲网格向上或向下移动的形式呈现。
流线图显示了速度场中的粒子路径,三维空间中平均速度的分布。颜色表示速度的幅度。
向量图描绘了指示三维网格或点数据集的分量值的方向和幅度的线或向量。值的幅度由矢量的长度和颜色指示。
散点图在数据文件中指定的坐标空间(XYZ)中显示字符。如果数据文件包含每个点的值,那么这些值将以不同的颜色表示。
您可以在任何图形中以不同角度放置几个截止平面,以仅显示感兴趣的区域。
Voxler允许您使用反距离方法和具有散射(XYZ坐标值为C)的XYZC数据的局部多项式来创建均匀的三维网格。您还可以计算给定搜索半径内的各种指标,包括最小值,最大值和平均值,四分位数,标准差,方差,丰度,密度以及到最近或最远点的距离。
Voxler为您提供了执行计算的各种选项,包括避免重复点的过滤器,基于X,Y,Z轴或数据的值删除数据,计算各种度量和过程映像。附加模块使您可以同时使用三个包含三维图形的文件来执行计算,最多合并五个文件,重新选择,使用子集并执行转换操作。
您可以使用诸如散射光,照明器,定向光,光点,具有点光源的照明之类的选项将照明添加到图形中,还可以选择照明的颜色,强度和方向。您可以使用Dragger图形工具放置光源。
For Englisher
Golden Software Voxler is an innovative way to graphically represent 3D data. It allows you to import data from various sources and create high-quality graphs that reflect the complex relationships between the data. Golden Software Voxler is a multi-functional interactive graphical environment for processing models and data of any complexity. A user-friendly interface provides quick visualization, evaluation, research and verification of your data.
Golden Software Voxler can be used in various fields:
In geology (when working with three-dimensional data on wells) and petrography, for seismic studies.
In meteorology, to study the atmosphere by collecting and processing three-dimensional data.
In oceanology, to study water temperature, salinity and pollution.
In biology and medicine (for conducting ultrasound studies).
In engineering, statistics, seismology, etc.
Key Specifications:
The ability to create isosurfaces allows you to expand the capabilities of the contour graph and depict the surface of constant values in three dimensions. You can depict several isosurfaces on the same graph, choosing for each its own color and degree of transparency.
On the volumetric graph, each element of the three-dimensional grid is assigned a color and a transparency level. The ClipPlane function allows you to cut at any angle.
The contour graph displays lines of constant plane values. You can place the plane and contours at any angle.
In height field graphs, data is indicated by different colors on a rectangular plane located in three-dimensional space, or on a two-dimensional curved grid. The amplitude of the data is presented in the form of a shift up or down perpendicular to this plane or curved grid.
The flow line graph displays the particle path in the velocity field, the distribution of average velocities in three-dimensional space. The color indicates the amplitude of the speeds.
The vector graph depicts lines or vectors indicating the direction and amplitude of the values of the components of a three-dimensional grid or point dataset. The amplitude of the values is indicated by the length and color of the vector.
The scatter plot displays characters in the coordinate space (XYZ) specified in the data file. If the data file contains values for each point, these values are indicated in different colors.
You can place several cut-off planes at different angles in any graph to display only that area of interest.
Voxler allows you to create a uniform three-dimensional grid using the inverse distance method and the local polynomial for XYZC data with scatter (XYZ coordinates with a value of C). You can also calculate various indicators within a given search radius, including the minimum, maximum and average value, quartiles, standard deviation, variance, abundance, density and distance to the nearest or farthest point.
Voxler provides you with various options for performing calculations, including filters to avoid duplicate points, delete data based on the values of the X, Y, Z axes or data, calculate various metrics and process images. Additional modules allow you to perform calculations simultaneously with three files containing three-dimensional graphs, combine up to five such files, re-select, work with subsets and perform conversion operations.
You can add lighting to the graph using options such as diffused light, illuminator, directional light, light spot, lighting with a point source of light, and also choose the color, intensity and direction of lighting. You can use the Dragger graphics tool to place light sources.
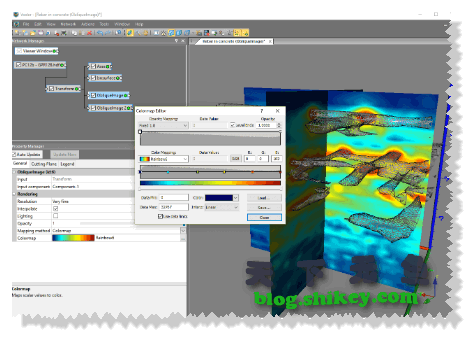
软件截图
软件特色
1、创建3D模型
增进您对三维数据的了解。Voxler将您的数据转换为易于决策的综合模型,并将关键信息传达给利益相关者和客户。确信您的数据可以用Voxler准确表示。Voxler 3D模型、井眼(直井)或偏井、表面、点云、激光雷达、轮廓、块、精简、向量。
2、增强模型
通过Voxler的众多自定义选项,以最佳状态显示数据。将模型的各个方面控制到最小的细节,以便您以易于理解的方式传达复杂的想法。
Voxler自定义选项:
标题,轴,比例尺
图例,轮廓,横截面、
编辑所有轴参数,包括多个轴
结合多种模型
任意角度切片模型
插入裁剪平面和边界框
完全控制不透明度,光照和纹理选项
编辑文字,线条,填充和符号属性
添加文本,折线,多边形,符号和样条线
包括地理参考图像
3、确定的网格数据
对模型的准确性完全有信心。Voxler将根据您规则或不规则排列的3D数据生成均匀的3D晶格。使用度量计算(包括数据顺序统计信息(最小值,下四分位数,中位数,上四分位数,最大值,范围,中范围,四分位数范围)),矩统计信息(均值,标准差,方差,变异系数)深入研究数据的详细信息,总和),其他统计信息(均方根,中位数绝对偏差)和位置统计信息(计数,密度,最近距离,最远距离,中值距离,平均距离)。
Voxler插值功能
网格化方法:反距离和局部多项式
过滤,排除数据
在晶格上执行数学运算
变换,合并,重新采样晶格
提取晶格的子集或切片
4、完全兼容
无缝可视化和分析来自多个来源的数据。Voxler可以读取多种文件格式,包括AutoCad DXF和LiDAR LAS。Voxler还支持所有流行的导出格式。Voxler简化了建模工作流程。

5、充满信心地合作
与利益相关者,客户和同事快速共享模型。模型准备好以PDF或TIFF等高质量格式进行印刷出版,或者通过将其导出为PNG或SVG格式在线共享您的作品。可以通过简单的复制和粘贴将图表插入Microsoft Word或PowerPoint等演示工具中,或者使用Voxler的内置视频工具捕获视频来获得更动态的视图。
6、丰富的二开接
不要浪费时间反复进行相同的过程。创建脚本以自动执行重复任务。可以从任何自动化兼容的编程语言(例如C ++,Python或Perl)中调用Voxler。Voxler还附带了Scripter,后者是内置的Visual Basic兼容脚本工具。
通过阅读Voxler自动化知识库中的大量示例脚本,可以节省自动化时间,并节省更多时间!

下载地址及教程
教程下载:
软件下载:
2、不是24小时在线的,请耐心等待。
3、切勿外传资源,赚个积分得不偿失,后台记录一致的话直接封号!!!
4、求各位友站大佬放过,毕竟你在这边也是有相关记录的。
